Join As Students, Leave As Professionals.
Develearn is the best institute in Mumbai, a perfect place to upgrade your skills and get yourself to the next level. Enroll now, grow with us and get hired.

Clustering in Data Analytics – Types, Applications & Real-World Use Cases
Explore Clustering in Data Analytics, its types, real-world applications, and use cases. Learn how businesses leverage clustering for data-driven insights.
Artificial intelligence
data analytics
Data clustering
Develearn
Clustring Techniques
Develearn Institute
7 minutes
July 17, 2023
Introduction: Understanding Clustering in Data Analytics
Clustering is a fundamental concept in Data Analytics and Machine Learning, used to group similar data points based on patterns and similarities. From Netflix movie recommendations to Amazon product categorization, clustering helps businesses organize large datasets efficiently.
In this guide, we will explore clustering techniques, their types, real-world applications, and how clustering enhances decision-making in business intelligence.
What is Clustering?
Clustering is a Machine Learning algorithm that falls under unsupervised learning. It is primarily used for grouping unlabeled and unstructured data based on common characteristics.
Think of it like this – If you have millions of unorganized customer data points, clustering will help categorize them into logical segments based on similarities, allowing businesses to make strategic decisions.
Types of Clustering in Machine Learning
There are various clustering techniques, each suited for different types of data:
Partition-Based Clustering – Groups data into predefined clusters (e.g., K-Means, K-Medoids).
Hierarchical Clustering – Forms a hierarchy of clusters (e.g., Agglomerative, Divisive).
Density-Based Clustering – Groups based on data density (e.g., DBSCAN, OPTICS).
Distribution-Based Clustering – Uses probability distributions (e.g., Gaussian Mixture Model).
Subspace Clustering – Identifies overlapping data clusters in high-dimensional spaces.

Why is Clustering Important?
Clustering helps in:
✔ Grouping similar data points for better analysis
✔ Detecting anomalies or fraudulent activities
✔ Understanding customer behavior for targeted marketing
✔ Enhancing medical image diagnostics
✔ Reducing complexity in big datasets
Types of Clustering Algorithms
1. Partition-Based Clustering (K-Means Clustering)
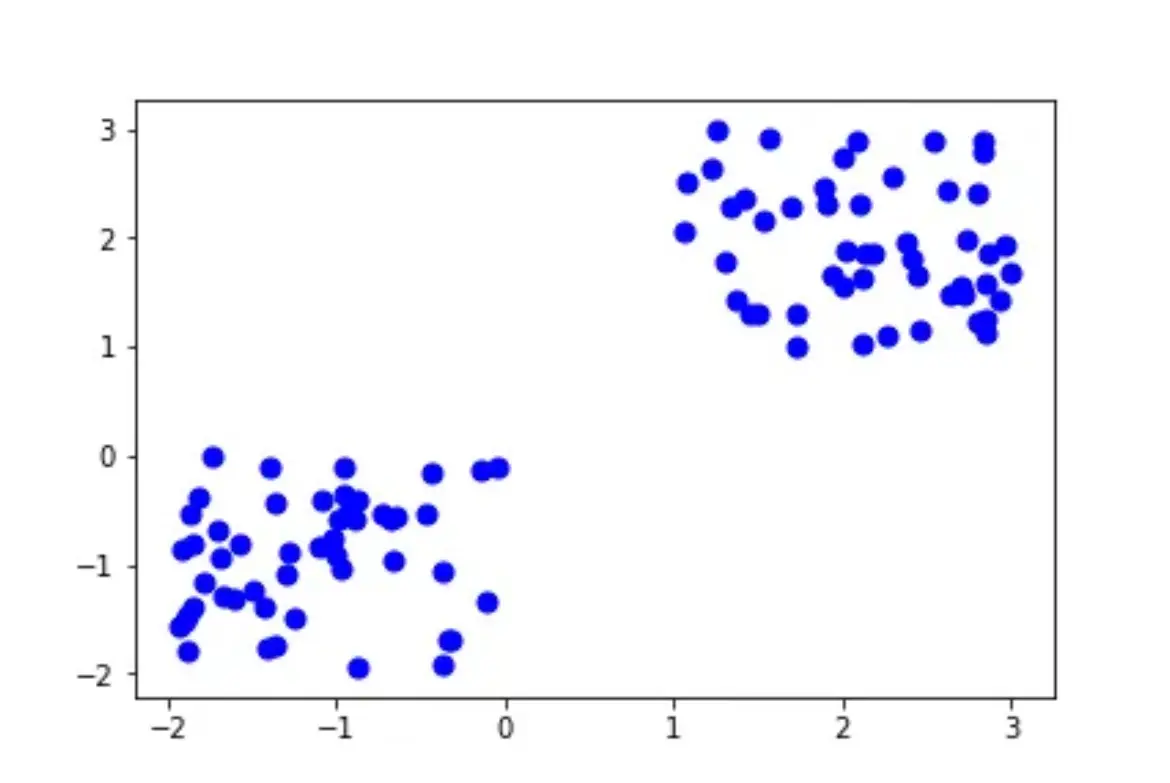
Partition-based clustering divides data into K clusters, with each data point belonging to the nearest cluster.
✔ Fast and efficient for large datasets.
✔ Used in market segmentation & customer behavior analysis.
✔ Requires pre-defined K value.
Example: Netflix movie recommendations, where users are grouped based on viewing history.
2. Hierarchical Clustering
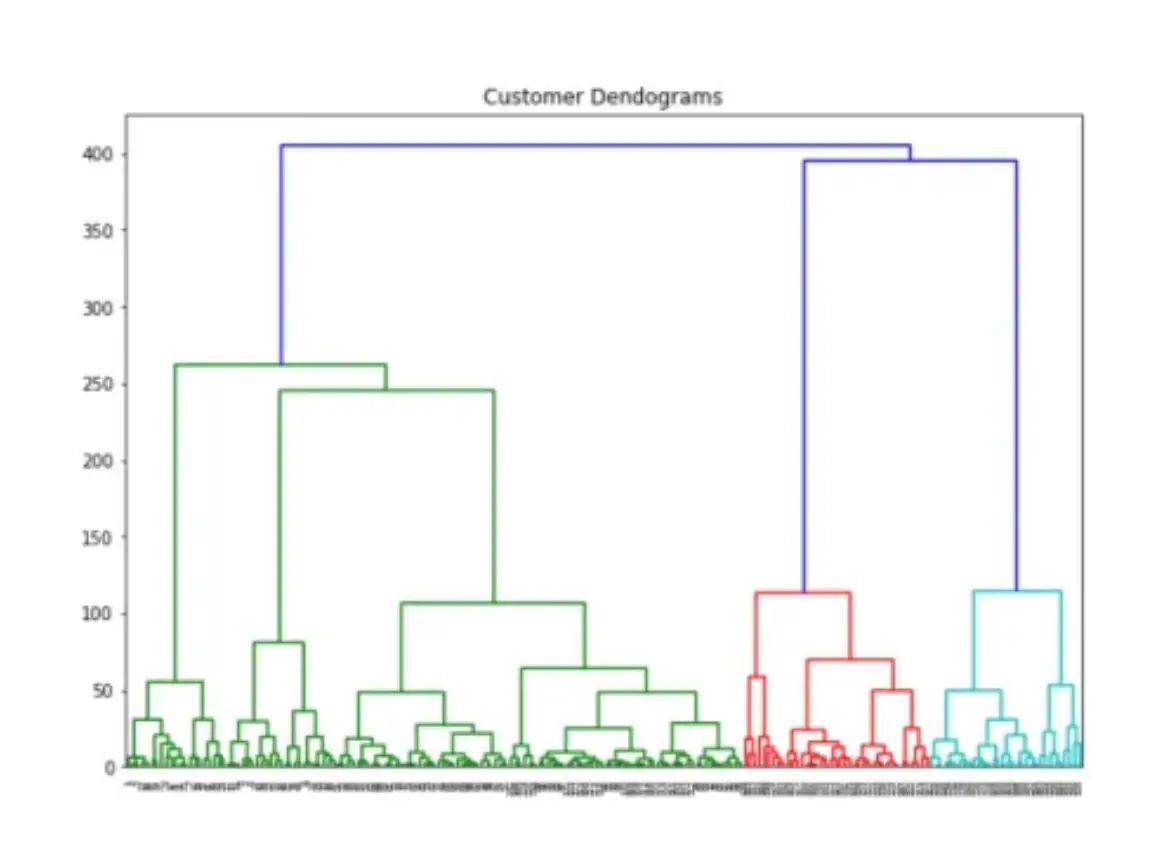
Hierarchical clustering builds a tree-like structure (dendrogram) where similar data points are merged step by step.
✔ Used in biological taxonomy, fraud detection, and document classification.
✔ No need to predefine cluster count.
✔ Computationally expensive for large datasets.
3. Density-Based Clustering (DBSCAN)
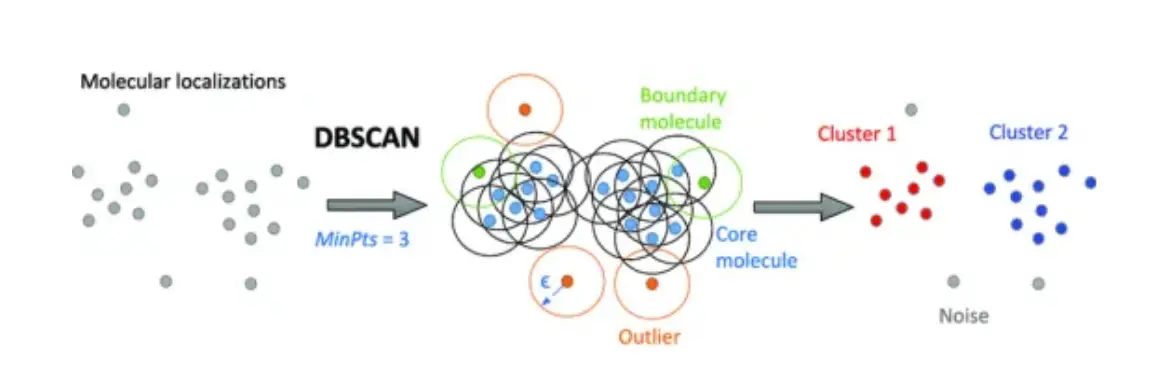
Density-based clustering identifies high-density regions separated by low-density spaces.
✔ Handles arbitrarily shaped clusters.
✔ Used in image processing, geospatial data analysis, and anomaly detection.
✔ Not suitable for high-dimensional data.
4. Distribution-Based Clustering (Gaussian Mixture Model - GMM)
Distribution-based clustering fits data to probability distributions.
✔ Works well with complex, overlapping clusters.
✔ Used in financial modeling, fraud detection, and AI-driven forecasting.
✔ Sensitive to model assumptions.
5. Subspace Clustering
Subspace clustering identifies clusters in different feature subspaces.
✔ Used in social networks, movie recommendations, and genomic data analysis.
✔ Finds hidden relationships in high-dimensional data.
✔ Computationally expensive for very large datasets.
Case Study: K Means Clustering Algorithm
K means is an extremely popular iterative clustering algorithm. It aims to partition an input dataset into subgroups and in this each data point belongs to just one cluster that aims to seek out local maxima in each iteration. This algorithm works in broadly five steps:
Step 0: Find an adequate way to visualize your data. You can pick any 2 or 3 features that are relevant to plot on a graph. We will cluster(partition) our data by segmenting the data as seen in the plot.
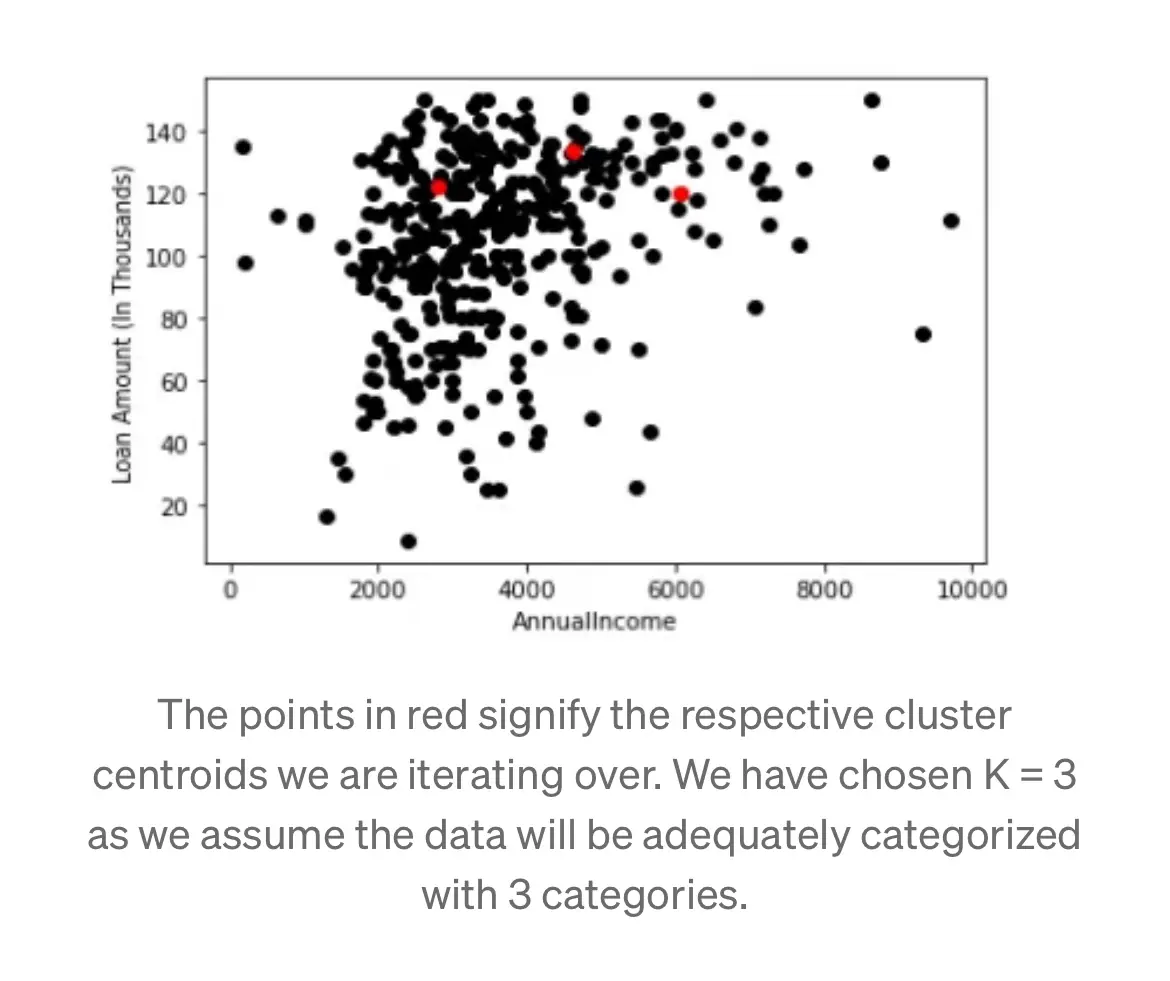
Step 1: Choose the number of clusters (k) number of clusters K=3

An example dataset that charts the loan amounts sanctioned to people based on their respective incomes.
Step 2: Select a random centroid(starting value) for each cluster
Step 3: Assign all the points to the closest cluster centroid
Step 4: Keep iterating until there is no changes to the centroid.i.e,Assign each datapoint to the closest cluster
The points in red signify the respective cluster centroids we are iterating over. We have chosen K = 3 as we assume the data will be adequately categorized with 3 categories.
Step 5: Repeat step 3 and 4 iteratively till we reach a stable solution for each of the K cluster centers(the improvement in the calculation of K becomes sufficiently small).
When this difference is 0, we are stopping the training. Let’s now visualize the clusters we have received.
The final result for the location of each of the K(=3) means. The data points are color-coded based on which of the 3 categories they are classified into.
The K-Means Clustering algorithm is conceptually elegant in how our decision of K in any problem will influence how data is classified through this method. We will explore the theory & workings of this algorithm in a later article.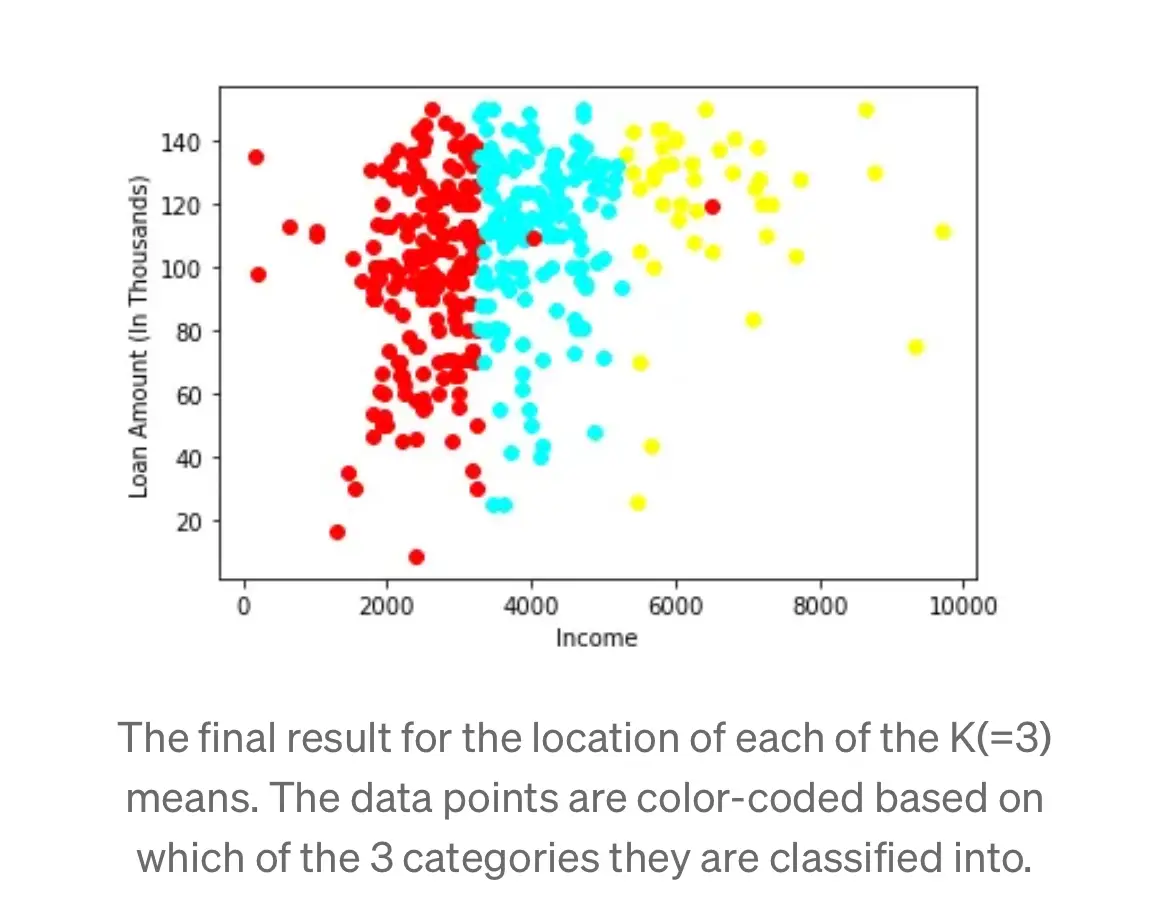
Applications
Let’s take a look at some impactful ways that Clustering works in tandem with other techniques to improve our everyday lives.
1. Identifying Fake News
The spread of fake news continues to increase across our present society although it has existed since ancient times.
The problem: The rapid spread of fake news occurs because of technology innovations, particularly social media platforms. The problem received widespread recognition during the 2016 US presidential campaign. The Fake News term received an exceptional number of mentions throughout this particular campaign.
How clustering helps: The algorithm operates through processing fake news content together with the corpus to analyze word usage before clustering them. The clustering process assists the algorithm to detect which news articles are genuine and which ones are fake. Click-bait articles contain specific words which appear more frequently within their content. The presence of particular terms at high levels in a text increases the likelihood that the content is fake news.
2. Identifying fraudulent or criminal activity
We will analyze fraudulent taxi driver conduct as the main subject of this scenario. The technique appears in numerous different applications.
The problem: The situation requires you to investigate suspected fraudulent driving behavior. The main difficulty lies in determining genuine information from false statements.
How clustering helps: the algorithm achieves grouping through its analysis of GPS data. The analysis groups share common attributes to identify real from fraudulent activities.
The classification process allows identification of actual driving activities from fraudulent ones.
3. Marketing and Sales
The practice of personalized marketing has become a major commercial opportunity.
The process works by examining individual traits to distribute marketing campaigns which have produced results with comparable individuals.
The problem: Businesses pursuing maximum marketing investment returns need to focus their target audience correctly. A wrong targeting approach might prevent your business from making sales and possibly destroy your Customer trust.
How clustering helps: Algorithms employed through clustering group individuals with similar characteristics who also possess comparable purchasing patterns together. The obtained groups enable you to perform marketing copy tests that will improve your future messaging direction for each group.
Future articles will present an exploration of effective clustering methods which exist in a vast field.
FAQs on Clustering in Data Analytics
Q1: What is the difference between clustering and classification?
A: The data groupings in clustering emerge through unsupervised learning based on similarity detection yet supervised learning through classification functions by defining labels.
Q2: What is the fastest clustering method?
A: K-Means Clustering is considered the fastest clustering method because it features both efficient computation and basic operational complexity.
Q3: What are the challenges of clustering?
A: Clustering can struggle with: ✔ Defining the optimal number of clusters. ✔ Handling outliers and noise. ✔ High-dimensional data complexity.
Q4: How does clustering help in business?
A: Businesses use clustering for: ✔ Customer segmentation ✔ Personalized marketing ✔ Product recommendation systems ✔ Fraud detection & risk analysis
Final Thoughts – Clustering for Smarter Decisions
Clustering is a powerful data analysis technique that helps businesses make data-driven decisions efficiently. From customer segmentation to fraud detection, the applications of clustering are vast.
🚀 Want to master Clustering & Data Analytics? Join DeveLearn Institute’s Data Analytics Course today!
📩 Contact us now for more details!


